Food Chains and Food Webs
How does energy flow through ecosystems?
In every ecosystem, primary producers and consumers are
linked through feeding relationships. Despite the great variety of
feeding relationships in different ecosystems, energy always flows in similar
ways.
Energy flows through an ecosystem in a one-way stream,
from primary producers to various consumers.
Food Chains
| You can think of energy as passing through an ecosystem
along a food chain.
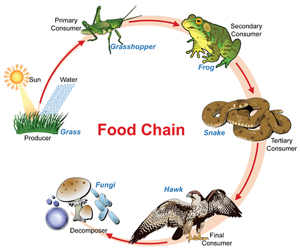
Food Chain
A series of steps in which organisms transfer energy
by eating and being eaten
Food chains can vary in length. For example, in
a prairie ecosystem, a primary producer, such as grass, is eaten by an
herbivore, such as a grazing antelope. A carnivore, such as a coyote,
in turn feeds upon the antelope. In this two-step chain, the carnivore
is just two steps removed from the primary producer. |
|
 |
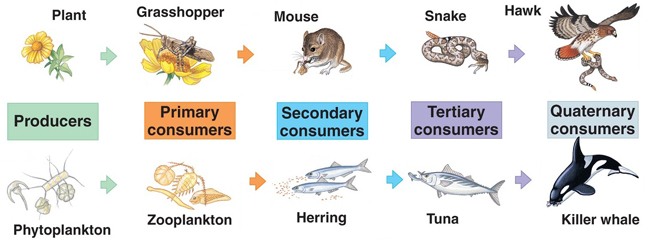
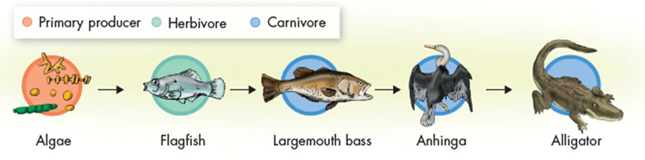
In some aquatic food chains, primary producers are a mixture
of floating algae called phytoplankton and attached algae.
Phytoplankton
Photosynthetic algae that live near the surface of
the ocean
As shown below, these primary producers may be eaten by
small fishes, such as flagfish. Larger fishes, like the largemouth
bass, eat the small fishes. The bass are preyed upon by large wading
birds, such as the anhinga, which may ultimately be eaten by an alligator.
There are four steps in this food chain. The top carnivore is therefore
four steps removed from the primary producer.
Food Webs
In most ecosystems, feeding relationships are much more
complicated than the relationships described in a single, simple chain.
One reason for this is that many animals eat more than one kind of food.
For example, on Africas Serengeti Plain, herbivores, such as zebras, gazelles,
and buffaloes, often graze upon several different species of grasses.
Several predators such as lions, hyenas, and leopards, in turn, often prey
upon those herbivores! Ecologists call this network of feeding interactions
a food web.
Food Web
A network of complex interactions formed by the feeding
relationship among the various organisms in an ecosystem
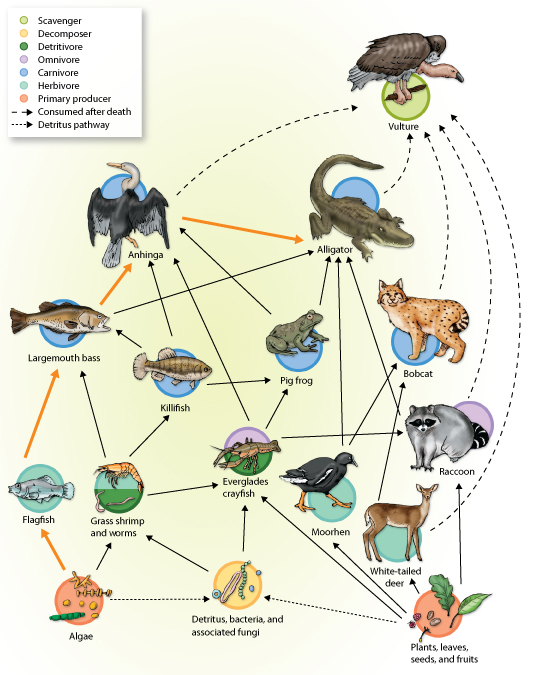
Food Chains Within Food Webs
The Everglades are a complex marshland ecosystem in southern
Florida. Here, aquatic and terrestrial organisms interact in many
overlapping feeding relationships that have been simplified and represented
in the image below. Starting with a primary producer (algae or plants),
see how many different routes you can take to reach the alligator, vulture,
or anhinga. One path, from the algae to the alligator, is the same
food chain you saw above. In fact, each path you trace through the
food web is a food chain. You can think of a food web, therefore,
as linking together all of the food chains in an ecosystem. Realize,
however, that this is a highly simplified representation of this food web,
in which many species have been left out. Now, you can begin to appreciate
how complicated food webs are!
Decomposers and Detritivores
in Food Webs
Decomposers and detritivores are as important in most
food webs as other consumers are. Look again at the Everglades web.
Although white-tailed deer, moor-hens, raccoons, grass shrimp, crayfish,
and flagfish feed at least partly on primary producers, most producers
die without being eaten. In the detritus pathway, decomposers convert
hat dead material to detritus, which is eaten by detritivores, such as
crayfish, grass shrimp, and worms. At the same time, the decomposition
process releases nutrients that can be used by primary producers.
Thus, decomposers recycle nutrients in food webs as seen in the following
food web. Without decomposers, nutrients would remain locked within
dead organisms.
Food Webs and Disturbance
Food webs are complex, so it is often difficult to predict
exactly how they will respond to environmental change. Look again
at the food web above, and think about the questions an ecologist might
ask about the feeding relationships in it following a disturbance.
What if an oil spill, for example, caused a serious decline in the number
of the bacteria and fungi that break down detritus? What effect do
you think that might have on populations of crayfish? How about the
effects on the grass shrimp and the worms? Do you think those populations
would decline? If they did decline, how might pig frogs change their feeding
behavior? How might the change in frog behavior then affect the other species
on which the frog feeds?
Relationships in food webs are not simple, and, as you
know, the food web seen above has been simplified! So, you might expect
that answers to these questions would not be simple either, and youd be
right. However, disturbances do happen, and their effects can be
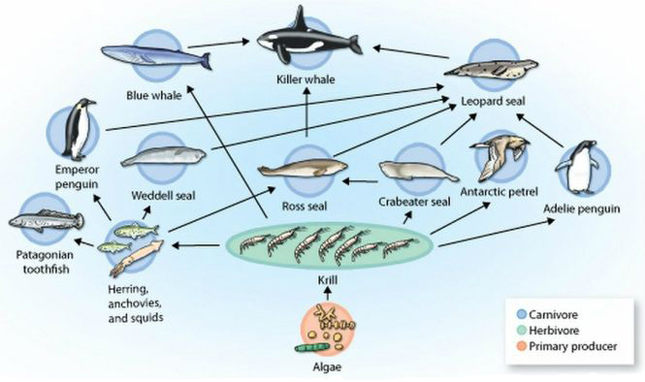
dramatic. Consider, for example, one of the most important food webs
in the southern oceans. All of the animals in this food web, shown
below, depend directly or indirectly on shrimp-like animals called krill,
which feed on marine algae. Krill are one example of a diverse group
of small, swimming animals, called zooplankton, that feed on marine
algae. Adult krill browse on algae offshore, while their larvae feed
on algae that live beneath floating sea ice. In recent years, krill
populations have dropped substantially. Over that same period, a
large amount of sea ice around Antarctica has melted. With less sea
ice remaining, there are fewer of the algae that grow beneath the ice.
Given the structure of this food web, a drop in the krill population can
cause drops in the populations of all other members of the food web shown.
How does energy flow through
ecosystems?
REVIEW & DO
NOW
Answer the following questions: |
| In what way does energy flow through an ecosystem?
What is a food chain?
What is phytoplankton? |
|
| What is a food web?
What is zooplankton?
Is zooplankton a producer or a consumer? |
|
Trophic Levels and Ecological
Pyramids
What do the three types of ecological pyramids illustrate?
Trophic Level
Each step in a food chain or food web
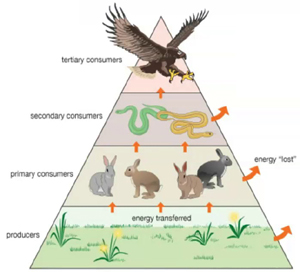
Primary producers always make up the first trophic level.
Various consumers occupy every other level. One way to illustrate
the trophic levels in an ecosystem is with an ecological pyramid.
Ecological pyramids
A pyramidal graph of the relative amount of energy
or matter contained within each trophic level in a given food chain or
food web
There are three different types of ecological pyramids:
1) Energy Pyramids
2) Biomass Pyramids
and
3) Number Pyramids.
Pyramids of Energy
Theoretically, there is no limit to the number of trophic
levels in a food web or the number of organisms that live on each level.
But there is one catch. Only a small portion of the energy that passes
through any given trophic level is ultimately stored in the bodies of organisms
at the next level. This is because organisms expend much of the energy
they acquire on life processes, such as respiration, movement, growth,
and reproduction. Most of the remaining energy is released into the
environment as heata byproduct of these activities.
Energy Pyramid
A pyramidal graph showing the relative amount of energy
available at each trophic level of a food chain or food web
The efficiency of energy transfer from one trophic level
to another varies. On average, about 10 percent of the energy available
within one trophic level is transferred to the next trophic level, as shown
above. For instance, one tenth of the solar energy captured and stored
in the leaves of grasses ends up stored in the tissues of cows and other
grazers. One tenth of that energy10 percent of 10 percent, or 1
percent of the original amountgets stored in the tissues of humans who
eat cows. Thus, the more levels that exist between a producer and
a given consumer, the smaller the percentage of the original energy from
producers that is available to that consumer.
Pyramids of Biomass and Numbers
Biomass
The total amount of living tissue within a given trophic
level
| Biomass is usually measured in grams of organic matter
per unit area. The amount of biomass a given trophic level can support
is determined, in part, by the amount of energy available.
Biomass Pyramid
An illustration of the relative amount of living organic
matter available at each trophic level in an ecosystem
Ecologists interested in the number of organisms at each
trophic level uses a pyramid of numbers. |
|
 |
Number Pyramid
An illustration of the relative number of individual
organisms at each trophic level in an ecosystem
In most ecosystems, the shape of the pyramid of numbers
is similar to the shape of the pyramid of biomass for the same ecosystem.
In this shape, the numbers of individuals on each level decrease from the
level below it. To understand this point more clearly, imagine that
an ecologist marked off several square meters in a field, and then weighed
and counted every organism in that area. The result might look something
like the pyramid above.
In some cases, however, consumers are much less massive
than organisms they feed upon. Thousands of insects may graze on
a single tree, for example, and countless mosquitoes can feed off a few
deer. Both the tree and deer have a lot of biomass, but they each
represent only one organism. In such cases, the pyramid of numbers
may be turned upside down, but the pyramid of biomass usually has the normal
orientation.
What do the three types of ecological
pyramids illustrate?
REVIEW & DO
NOW
Answer the following questions: |
| What are trophic levels?
What type of organism always makes up the first trophic
level?
Give an example of an organism in the first trophic level.
Name and define the three types of ecological pyramids. |
|
| On average, about how much of the energy available in
one trophic level is transferred to the next?
What is biomass?
How can the amount of biomass supported by a given trophic
level be determined? |
|
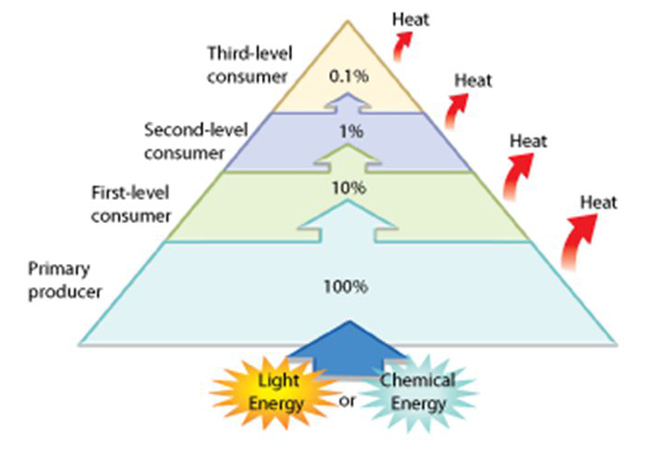
The 10 Percent Rule
.
As shown in Figure 311, an energy pyramid is a diagram
that illustrates the transfer of energy through a food chain or food web.
In general, only 10 percent of the energy available in one level is stored
in the level above. Look at Figure 311 and answer the questions below.
.
1. Calculate
If there are 1000 units of energy available at the producer
level of the energy pyramid, approximately how many units of energy are
available to the third-level consumer?
.
2. Interpret Diagrams
What is the original source of the energy that flows
through most ecosystems? Why must there be a continuous supply of energy
into the ecosystem?
.
3. Infer
Why are there usually fewer organisms in the top levels
of an energy pyramid? |
|
|